

Low key and high impact. That is a good beginning description of John D. Johnson, research fellow for Marquette Law School’s Lubar Center for Public Policy Research and Civic Education.
The soft-spoken, almost-always casually dressed 33-year-old Johnson came out of nowhere—well, rural Illinois—to join the Law School’s public policy initiative in 2016. He has become widely recognized in the region as the go-to person for knowledge about key trends that are shaping life in Milwaukee and Wisconsin. Johnson is an excellent researcher and number cruncher who comes up with fresh insights time and again and who is eager to share what he finds with the public.
Population trends in Milwaukee? Insight into how large investors are buying up low-cost property in Milwaukee and often making a lot of money in doing so? Straight-shooting and nonpartisan analysis of political redistricting in Wisconsin? The decline in births in Milwaukee? Innovative analysis of voting trends across the state? Detailed results of the Marquette Law School Poll? A look at the most common domesticated animal in every county in the country? Johnson is on top of each of those and a lot more, while still leaving time for the camping, hiking, bike riding, and other outdoor explorations that he loves.
Johnson’s groundbreaking work is quoted often in the media. He has collaborated with colleagues in building databases that are available to the public on subjects such as property ownership in Milwaukee. He and Mike Gousha, Marquette Law School’s senior advisor in law and public policy, work together on several major pieces each year, appearing in the Milwaukee Journal Sentinel, on trends shaping the Milwaukee area. And Johnson plays important roles in analyzing the results of the Marquette Law School Poll and posting the analyses in ways that make specific information accessible to the public.
The Marquette Lawyer asked Johnson to offer thoughts and observations about his work in his own words.
More available data, more need to understand things
More information, in the sense of raw data, is available now than ever before, but relatively few people are employed with the technical skills and time required to make sense of it. To give just one example: The City of Milwaukee has an annual budget in excess of $2 billion. Its legislative reference bureau, which provides research support and fiscal analysis for the Common Council (which allocates this money), employs 10 research staff—a number unchanged from 25 years ago. My job at the Law School’s Lubar Center for Public Policy Research and Civic Education is to explain quantitative data about important public policy concerns in a fair and accessible way. My role exists halfway between journalism and traditional academia.
The questions I seek to answer come from the former. Major news organizations are generally based on the East Coast, and the number of working journalists nationwide has declined sharply. Even when a national outlet writes an accurate and thoughtful article about Milwaukee or Wisconsin, it must explain why the story matters to the rest of the country. I am unconstrained by that framing. Milwaukee, let alone Wisconsin, is large enough to justify its own specific coverage. The state, after all, has more residents than entire countries such as Norway or the Republic of Ireland. If something matters to the 570,000 people living in Milwaukee, the 1.5 million in the metro area, or the 5.9 million in the state, that alone is justification enough for me.
Even so, Wisconsin’s experience is rarely singular. A close analysis of the situation here often yields useful insights for the rest of the country. In fact, much of the country bears more of a resemblance to us than to the coastal metropolises. Prominent media and cultural institutions are increasingly concentrated (or merely remain) in the handful of American “superstar” metros, to borrow economist Enrico Moretti’s term, that have won 21st-century economic competition.
One consequence is that our political vocabulary reflects the circumstances of those metros, and not the often-quite-different circumstances of cities that are not hubs of technology and finance. This is why, I believe, we hear so often about “gentrification” and less frequently about persistent, entrenched poverty—the condition that describes so much of Milwaukee. It is why we hear about high rents, skyrocketing property values, and restrictive land-use policies, but not the difficulties of building new housing in cities with many empty lots yet insufficient property values to justify conventional construction even when land is free.
Insights into political redistricting
Redistricting is a technically complex subject with enormous political consequences, so the Lubar Center readily identified it as a topic well-suited to our mission before the 2020 cycle even began. We had no way of knowing just how long the process would take. Not one or even two but three sets of Wisconsin legislative maps were, at least briefly, the law of the land. As of early 2026, litigation aiming to toss the congressional maps is still pending in state court.
My study and coverage of redistricting had two main goals: (1) to explain how the political geography of the state interacts with traditional redistricting criteria to shape the universe of probable maps and (2) to provide independent, transparent statistics quantifying the empirical attributes of every proposed map.
The first goal required explaining how two separate issues contributed to the Republican stranglehold on the state legislature under the maps drawn in 2011. It is true that the maps were a classic partisan gerrymander drawn by Republicans to preserve their legislative majorities won in the 2010 Tea Party landslide election. The skill of this gerrymander was evident through any number of metrics. Here’s one: from 2014 through 2020, across 396 Assembly races, only 7 seats changed hands between the parties.
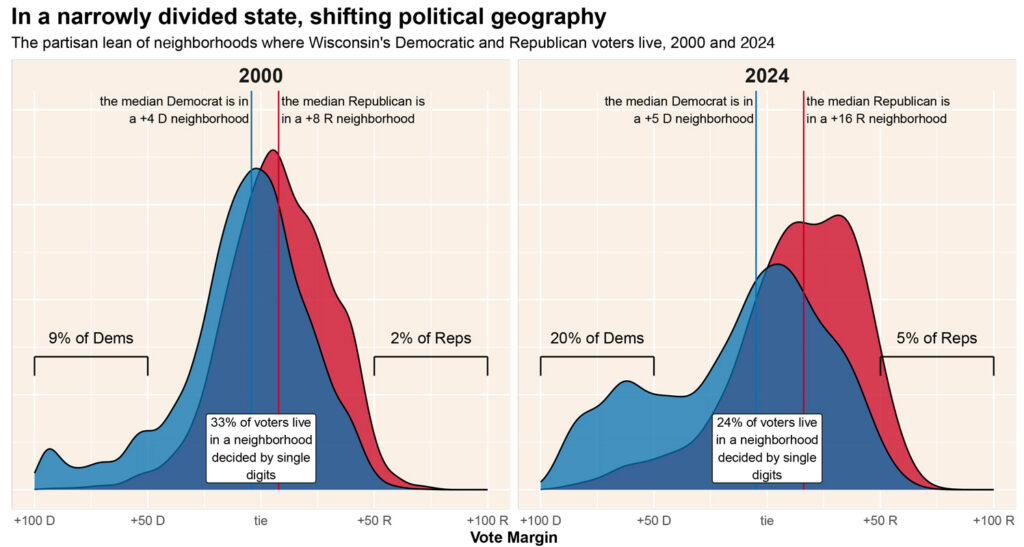
Nonetheless, the 2011 gerrymander is not the sole reason why Republicans enjoyed such an advantage in the state legislature. In fact, they probably would have won the same number of seats in 2014 and 2016 in a randomly generated map. Patterns in where Democratic and Republican voters live currently create a sort of natural, or baked-in, advantage for the Republican Party. Democrats are a lot more likely to live in a very Democratic place than Republicans in a very Republican place, and this difference has grown over time. This asymmetrical concentration of Democrats means that a randomly drawn map of compact districts will almost inevitably “waste” Democratic votes by packing more of them into dark-blue seats than Republicans in dark-red seats.
Explaining these two facts (the gerrymander and the geography) was a balancing act, because members of each party were eager to consider one but not the other. Each fact, by itself, was only part of the truth, and any independent effort to draw genuinely nonpartisan maps would have to grapple with the way a map drawn faithfully according to neutral redistricting principles would still appear not at all “neutral” in its political implications.
Tackling the data on redistricting
Fundamentally, redistricting plans are lists of census blocks as assigned to districts. Census blocks are tiny—there are more than 200,000 in Wisconsin. By merging the U.S. Census Bureau’s “block assignment files” onto spatial data and other census records, I could answer a variety of questions: How compact are these planned districts? Are they contiguous? How closely do they follow municipal and county boundaries? And, most importantly, which party would probably win an election in this district?
In principle, there is no reason why these calculations couldn’t be done on a national scale, and several organizations did achieve prominence by doing exactly that during the 2020 cycle. But large amounts of the necessary data are collected locally and vary in quality and consistency. I chose to perform these calculations myself, starting from scratch with the original source datasets (some of which I assembled myself). In so doing, I helped correct serious errors in two of the national projects. Because the format of election data is so idiosyncratic, it pays to do this analysis with local expertise.
[V]oters in Wisconsin might be easier to predict than anywhere else.
Wisconsin’s state legislative redistricting saga finally ended after the new “liberal majority” on the state Supreme Court invalidated the maps used in 2022 and solicited new proposals from across the political spectrum. Surveying their options, Republican legislators decided to cut their losses and passed a map proposed by the Democratic governor in early 2024. The various proposed maps originally submitted to the court would have achieved a wide range of political ends—from heavily Republican to tilting Democratic—but many of them scored remarkably similarly on standard redistricting criteria (compactness, contiguity, maintenance of communities of interest, etc.). One lesson I took from this is that following traditional redistricting principles is no cure for gerrymandering. Sufficiently motivated partisans can accomplish their political ends even under those constraints.
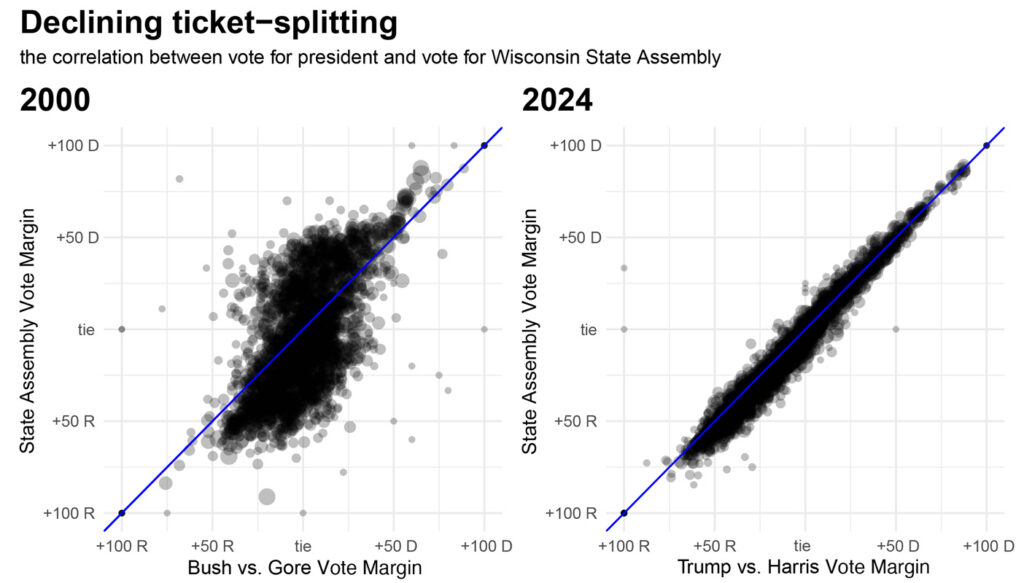
I’ve become increasingly convinced that the real strength behind the gerrymanders we see around the country is less the growing skill of the consultants drawing the maps and more the growing predictability of the voters themselves. In contrast to the recent past, voters today rarely split their tickets within elections and seldom switch party allegiances between elections. Gerrymandering works only when voters are easy to predict.
Currently, voters in Wisconsin might be easier to predict than anywhere else. The change between how counties voted from 2020 to 2024 was the smallest in the state’s history. Literally no other state has been as closely divided between Democrats and Republicans in three consecutive presidential elections as Wisconsin in 2016, 2020, and 2024. Despite this near-stasis in the electorate, the tiny shifts that did occur exactly matched the national outcome. Our electoral votes have gone to the national winner each of these times. All this makes Wisconsin an especially illuminating place to understand the factors that drove President Trump’s victory in 2024.
The following collection of facts must be considered in unison to really understand the 2024 presidential election in Wisconsin. In contrast to the nation, turnout in the state increased. Turnout, as a share of eligible voters, was higher in Wisconsin than in any other state in 2024. Trump’s share of the vote grew nearly everywhere in the state—in 68 of 72 counties—including the biggest cities and the smallest rural areas. Support for Trump grew in the most-white places and also the most-Black and most-Hispanic in terms of population. Growth in Trump support was not closely correlated with increased turnout. Both his supporters and opponents were highly motivated to vote. Still, it’s easy to get carried away by a Trump popularity narrative. Trump’s increase in support in Wisconsin, while geographically widespread, was small. Relative to 2020, his share of the vote grew by 0.77 percentage points—the third-lowest increase in the country and the lowest among all swing states. Yet it was enough.
Important trends in Milwaukee home ownership
The City of Milwaukee maintains an unusually old and extensive database of property information, with annual records for each year archived since 1975 and almost 100 data points on each property. These data, combined with transaction records, have been a particularly helpful tool for me in seeking to answer many questions about Milwaukee’s housing market. Naturally, the data are specific to Milwaukee, but our findings have drawn considerable interest from people in other midwestern cities, whose experiences, it turns out, have been similar.
The mortgage foreclosure crisis and the fallout from the Great Recession lasted longer and affected more households in Milwaukee than the national average. Citywide, 14 percent of all houses experienced at least one foreclosure from 2007 to 2016. In some neighborhoods, this was more than 30 percent. Using granular parcel and transaction data, I was able to trace, in exacting detail, the scope of Milwaukee’s foreclosure crisis and who ultimately acquired those properties.
In broad strokes, here is what we learned in Milwaukee. As more and more Milwaukee houses hit the market at basement prices, they were often purchased by a growing number of individual investors from states such as California, Texas, and Illinois. These investors shared tips and strategies on web forums. By their own admission, many of them had no connection to Wisconsin, and some never even visited the state. Rather, they contracted with local property management firms to handle the operations side of things. Some of these investors bought only a handful of properties, while the largest would gradually acquire up to several dozen.
Large corporate single-family-housing investors such as Invitation Homes and American Homes 4 Rent entirely avoided Milwaukee and cities like it in favor of sunbelt metro areas. But the smaller investors understood something that those large companies may have missed. Milwaukee, despite its shrinking population and often-dilapidated housing stock, was still a very profitable place to be a landlord, simply because rents were remarkably high relative to home values.
As this rental market dynamic became more widely understood, a group of out-of-state companies with private equity funding (three, by my count) began buying up hundreds of single-family homes and duplexes across the city’s north side. This buying activity began in the late 2010s, around the same time that the homeownership market slowly began to recover. Yet beginning in 2018, the city ended each year with steady net increases in the number of owner-occupiers. Many of these owner-occupier increases were happening in the same neighborhoods as where these new corporate landlords were buying houses. Obviously, this raised a new question. If large corporate landlords were increasing their portfolios at the same time as the nascent wave of new owner-occupiers, who was buying from whom?
I found the answer by matching real estate conveyance records with parcel data. This way, I could see not just the names of the grantor and grantee but also the address of each and the legal nature of the transaction. I found that, whereas during the housing crisis landlords bought houses previously owned by distressed owner-occupiers, beginning in the late 2010s corporate landlords built their holdings by buying out entire portfolios of smaller landlords. Rather than buying from owner-occupiers, the new breed of corporate landlords was competing with would-be owner-occupiers for the same pool of homes owned by smaller landlords looking to get out of the business.
Our research into these larger landlords—their competition with prospective homeowners and their negative implications for tenants—landed at the right time. Public concern about the phenomenon was growing, both in Milwaukee and in other cities. One useful policy response to the phenomenon was a multimillion-dollar housing acquisition fund created and managed by the local nonprofit Acts Housing but attracting funding from the public sector. The goal of the fund is to compete in the same market as the large corporate landlords. Using the fund, Acts can complete all-cash, even whole-portfolio, transactions with landlords leaving the business, as well as participate in foreclosure auctions. Acts Housing then sells the properties to new homeowners, who complete its financial counseling program, and the proceeds of the sales replenish Acts’ acquisition fund’s capital. Our research, I have learned, was instrumental in making the case for why this approach was needed to foster homeownership opportunities in Milwaukee.
The work didn’t stop there. After matching property ownership records manually for several research projects, a colleague and I decided to expand the analysis to the whole city, automate many aspects of it, and publish the results. We created a website, mkepropertyownership.com, where a user can input the address of any residential rental property in the city and immediately view the web of discrete legal owners (usually LLCs) associated with that property. To my knowledge, this website made Milwaukee just the second U.S. city to have such a resource when we published it.
This method of linking individual parcel ownership records is called “network analysis.” Combined with Milwaukee’s remarkably extensive archive of parcel ownership records (again, dating back to 1975), it would be possible to calculate ownership networks in each prior year and to link them from one year to another. This analysis, which I intend to conduct in the future, will allow us to understand the degree of owner concentration which exists in each segment of the rental market and the ways in which that concentration has evolved over time.
Why the number of housing units stays the same as population declines
Understanding who owns Milwaukee’s properties is only half the housing market puzzle. The other half is the demand side—who lives here? Studying how Milwaukee’s population is changing reveals much about the current (and future) demand for housing, schools, and amenities generally.
At first glance, Milwaukee’s demographic trajectory presents a mystery. The city’s population has fallen in every census since 1960. Since 1990, the population has fallen by 8 percent. Why hasn’t demand for housing cratered? Why is Milwaukee not like Detroit, where swaths of the city have been practically abandoned? The answer is twofold.
First, even though the total population has fallen sharply in Milwaukee, the number of occupied housing units (or “households” in census speak) has remained about the same. Since 1970, the number of two-person households has remained about the same; the number of households with three or more members has fallen by 32,000; and the number of single-member households has risen by 33,000. From 2010 to 2020, Milwaukee’s population fell by about 17,600, but the city actually added 5,200 more households. Even as the population falls, the demand for new housing is growing because more people want to live alone.
The second reason why Milwaukee’s housing market didn’t crater like Detroit’s is a little more complicated. (1) Milwaukee has actually experienced the Detroit scenario of outright depopulation (shrinking population and fewer households), but that depopulation has been limited to 57 of the city’s 210 census tracts, mainly on the near north side.
The rest of the city has experienced something else. (2) Over the first two decades of the 21st century, 34 tracts experienced a building boom, where new construction fueled population increases. (3) Another 33 tracts didn’t build any new housing, but actually saw a small population increase because immigrants with larger families moved in. (4) The largest chunk of the city (86 tracts) underwent a stable decline.
Anyone seeking to grow Milwaukee’s population must grapple with these four different trajectories.
In Milwaukee, land is cheap (approaching “free” in some neighborhoods), empty lots are numerous, and existing land-use rules are not particularly restrictive. I’ve identified hundreds of privately held empty lots where an owner could already build a four-unit apartment building by right. In fact, no housing is built in these places because, in about half of Milwaukee (the half containing the lion’s share of empty lots), it’s impossible to build and sell a conventional house (or apartment building) without losing money.
The basic problem in Milwaukee, and, indeed, pretty much everywhere in the United States, is that the hard costs of homebuilding have reached unprecedented heights. My favorite way to show this is by comparing the construction costs of common Milwaukee homes with the wages earned by ordinary workers during the year when the house was built. For example, in 1890, a typical carpenter salary in Milwaukee was $588, and a simple cottage could be had for $1,000 (1.7x salary). The quality and cost of housing increased over the following decades. By 1929, a simple bungalow cost $6,200, or 2.7x the average carpenter’s salary of $2,238. In the early 1950s, carpenters earned $5,595 on average, which meant that the cost of a standard new Cape Cod home ($13,800) was 2.5x the salary. In 2025, the cheapest new house in Milwaukee cost $349,000; the average carpenter earned $62,260, meaning that house would cost 5.6x income.
It costs many more multiples of a typical salary to build a house today than it cost when our cities, towns, and villages were built . . . . We need solutions that reduce the cost of construction itself.
These numbers are imperfect measures, but they’re illustrative. It costs many more multiples of a typical salary to build a house today than it cost when our cities, towns, and villages were built. This is the fundamental problem afflicting almost everywhere in America, and liberalizing land-use rules won’t solve it in most places because the cost to build is unaffordable to typical workers. We need solutions that reduce the cost of construction itself.
How to tackle a research idea
The projects I work on all feature quantitative elements. Sometimes I use more complex statistical modeling, but often only simple arithmetic is needed. The harder part is narrowing big policy topics into tractable research questions and finding data sources—sometimes novel ones—to answer them. Often, a research-ready dataset about my specific topic is not available, so I have to get creative, finding other administrative datasets that can shed some light on my own question.
My housing market research program is a good example of this. The main data sources I used were the city assessor’s tax rolls and the digital records of property transactions filed with the Wisconsin Department of Revenue. Both of these data sources exist mainly to help the local and state governments levy taxes. Neither of them was designed for longitudinal property ownership analysis. If they had been, many things about their structure and quality would have been different. Nonetheless, after careful data cleaning, matching, and cross-validation, I could extract from each source the information I needed to answer my own research questions.
To a remarkable degree, the tools needed to do this work are now freely available as open-source software. I mostly use the programming language R for all my data cleaning, wrangling, modeling, and geospatial needs. (These days, I use it for writing reports and building simple websites as well.) I aim to never manually alter my source datasets, which remain saved in their original form. All changes to the data are preserved and documented in programming scripts (and their outputs). This practice does not eliminate the risk of errors, but it does mean that the source of those errors is preserved for me or someone else to find.
Insights into the demographic future
I wonder a lot about what a declining population means for Wisconsin generally and Milwaukee specifically. Wisconsin’s official state demographic projections predict that the state’s population peaked in 2020 and will be 3 percent smaller in 2050. As Wisconsin’s population ages and shrinks, how will that affect Milwaukee?
Births to Milwaukee moms are falling, which isn’t a surprise—it’s true pretty much everywhere. But
what is surprising is the pace. Births in 2025 were down 5 percent from 2024 and 29 percent since 2010. That drop-off is happening much faster in the city than the suburbs (or the state overall). Obviously, this has all kinds of implications for the city, beginning with day cares and schools.
Long-term insights from the Marquette Law School Poll
The state now has fewer Democrats than Republicans, but those Democrats are much more likely to show up to vote.
Part of the original purpose of my appointment here in 2016 was to support the work of Charles Franklin, who serves as professor of law and public policy and director of the Marquette Law School Poll. In the 14-plus years our poll has existed, we’ve seen a realignment in who identifies with which party. Back when we started, Democrats handily outnumbered Republicans in the state, but Republicans could pretty often win midterm elections and were dominant in low-turnout April elections. Now things are exactly reversed. The state now has fewer Democrats than Republicans, but those Democrats are much more likely to show up to vote. Our polling gives an amazing window into how that realignment happened.
On a different note, I think our polling from the spring of 2020, right at the beginning of the COVID-19 pandemic, might be some of the most fascinating data we collected. Looking back, it’s easy to remember the pandemic as a time of vitriolic division over masks, vaccines, “social distancing,” etc. But I remain struck by the remarkable unity among Wisconsinites during the initial months. In March 2020, more than 80 percent of all party groups supported mandatory social distancing measures. In that same late-March poll, we asked about 200 people to describe in their own words, “How has the coronavirus outbreak affected you and your family?” and “What should the state and local government do to deal with the coronavirus outbreak?” For many, it’s impossible to discern party or ideology from their answers. That changed in the following months, but it’s important to know that the divisions we remember emerged over time and were not baked in from the start.
Each county’s most common domesticated animal
I grew up walking distance from my grandpa’s farm. At one time or another during my childhood, we raised and butchered chickens, grew and sold flowers, and ran a U-pick strawberry farm. One of my earliest memories is of my grandpa’s hog operation, just before he gave it up, unable to compete with the huge Concentrated Animal Feeding Operations (CAFOs) coming into the market. So I’ve always been aware of how hard farming is and how the increasing scale of the largest operators is changing the business.
Using data compiled by the U.S. Department of Agriculture, I made a map of the nation’s counties, showing the most common domesticated animals, first to answer my own curiosity and, second, to help other people understand how massive animal agriculture is—even when you can’t see it. To return to the hog example, in McDonough County, Illinois, where I grew up, pigs outnumber humans three to one. But these days, you could drive across the county on back roads without ever seeing one. That’s because 99.4 percent of the county’s hogs are raised in just nine massive CAFOs.
Finding the remotest spot in each Wisconsin county
I enjoy hiking in remote areas. I got to wondering what the remotest spots in each county were. For starters, I had to decide how to define remotest. I decided on “the farthest point from a road accessible to a car.” If you defined it differently, you’d get a different answer, of course.
Then, I had to figure out how to calculate these points. This ended up being conceptually simple, but computationally expensive (which is to say, you need a powerful computer to do it). Here’s how: Take every road in the state, buffer it by an equal amount on each side (let’s say, 500 meters), and subtract those buffered roads from the area of the state. You’re left with a bunch of polygons, the edges of which are 500 meters from the nearest road. Then, find the centroid of the biggest circle you can draw inside each of those polygons. The centroid of the circle with the biggest radius is your “remotest” point. The radius of the circle plus 500 meters is the distance to the nearest road.
One thing I learned from this exercise is that we have a ton of roads. The farthest you can get from a road in mainland Wisconsin (leaving aside the Apostle Islands and Lake Winnebago) is 2.37 miles. That point is in the Bad River Band’s reservation in Ashland County, near Copper Falls State Park.
Upcoming interests
I’m tracking the 2026 state legislative races in Wisconsin. This is the second election with our new maps, which give Democrats a real shot at winning a majority. However, Republican state legislators have usually been more popular than other kinds of Republicans. Will this be the year that Democrats finally win a majority of either (or both) chambers?
After this election, we’ll enter a narrow window of time where I think the state government might consider reforms to the redistricting process before the 2030 reapportionment. I’ll be tracking and evaluating any proposals that emerge, whether from elected officials or outside groups.
On the housing side of things, I want to learn more about the components of housing cost. Our big problem is that conventional construction just costs way more (as a multiple of typical wages) than it ever has before. Manufactured and modular housing is much cheaper, and, in rural Wisconsin, it’s quite common to see lots of these kinds of houses. But we rarely see manufactured or modular homes in established cities or suburbs. Why not?
I’m also looking forward to solving a mystery about Milwaukee’s population. The Census Bureau models annual net domestic migration at the county level, and its estimates show a net loss of 36,000 people moving from Milwaukee County to somewhere else in the United States from 2020 to 2024. This is not a trivial amount—it’s equal to almost 4 percent of the population. A loss of this many people in such a short time seems consequential to me. I want to figure out several things. First, did this actually happen, or is it some artifact of pandemic complications with the data? Second, if it did happen, where did those people leave from? Looking at the past 20 years, the lion’s share of the county’s population loss occurred in just a few dozen census tracts covering the central city’s north side. Does this hint at out-migration reflect a sudden flood of people exiting those neighborhoods?
Beginning with a love of maps
People sometimes ask how I got into research. I loved maps as a kid and would pore over old atlases. At some point we got a digital copy of Encyclopedia Encarta on CD-ROM, and I practically wore that thing out. My favorite subjects have always been history and geography, but I figured out pretty quickly that neither of those has a career path. Statistics rule the world today, so I decided to focus on that. Still, I try to bring a bit more of a qualitative and historically grounded approach to my work. Most of my reading is history.
When I finished graduate school in December 2015, I immediately began looking for work. My backup plan was teaching English overseas, and I was about a month away from moving to Korea when I was invited to interview with Marquette Law School. I’ve been here ever since. Besides my excellent colleagues, my favorite thing about working here is being in a place that encourages broad inquiry while grounding the research process in important, real-world issues.
This article was first featured in the Summer 2026 issue of Marquette Lawyer Magazine.